
Air Cargo Supply & Demand Analysis (Released April 2020)
7-minute read
Air Cargo Plunges in March as Covid-19 Spreads Globally
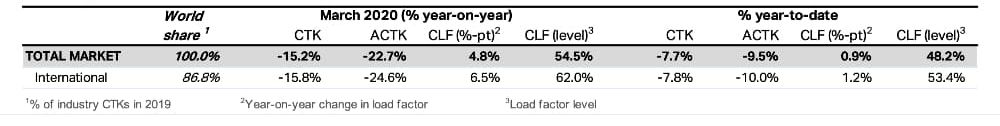
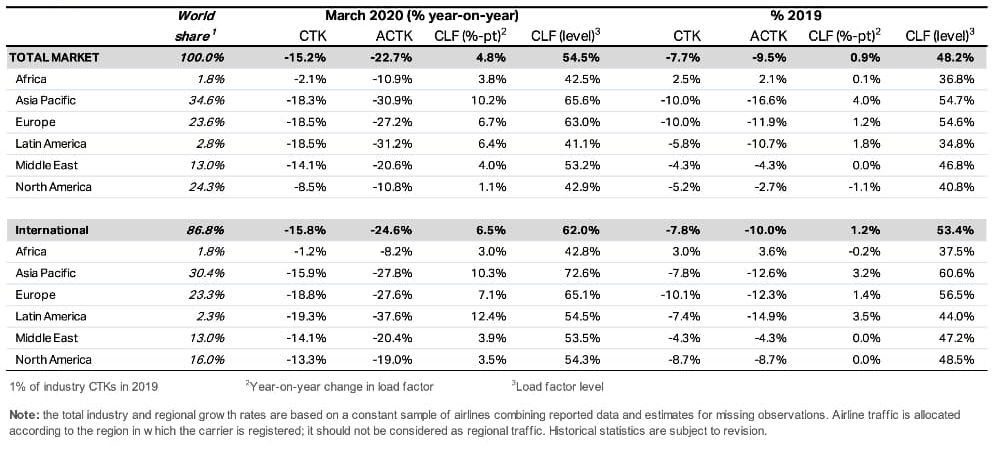
• Industry-wide cargo tonne kilometres (CTKs) contracted by 15.2% year-on-year in March, driven by sharply weaker demand across all regions as the COVID-19 outbreak extended to become a global pandemic.
• Industry-wide cargo capacity declined by 22.7% annually due to the reduction in bellyhold capacity, as the passenger fleet were increasingly grounded. Dedicated freighter operations raised their capacity and some passenger aircraft shifted to cargo-only operations which partly offset this decline. With capacity contracting by more than demand, the global cargo load factor improved by 4.8 ppts in March, compared with the same period a year ago.
• International CTKs in all regions, except for Africa, posted double-digit declines.
Cargo volumes contracted sharply in March
The impact of COVID-19 on the global air cargo volumes became significantly more pronounced in March, with industry-wide cargo tonne kilometres (CTKs) contracting by 15.2% year-on-year.
Global air cargo volumes have been weakening since November 2018 due to global trade tensions (notably US-China), now compounded by the COVID-19 outbreak.
CTKs have fallen in annual terms for 12 consecutive months now – the longest period of undisturbed decline since the Global Financial Crisis (GFC) in 2008.
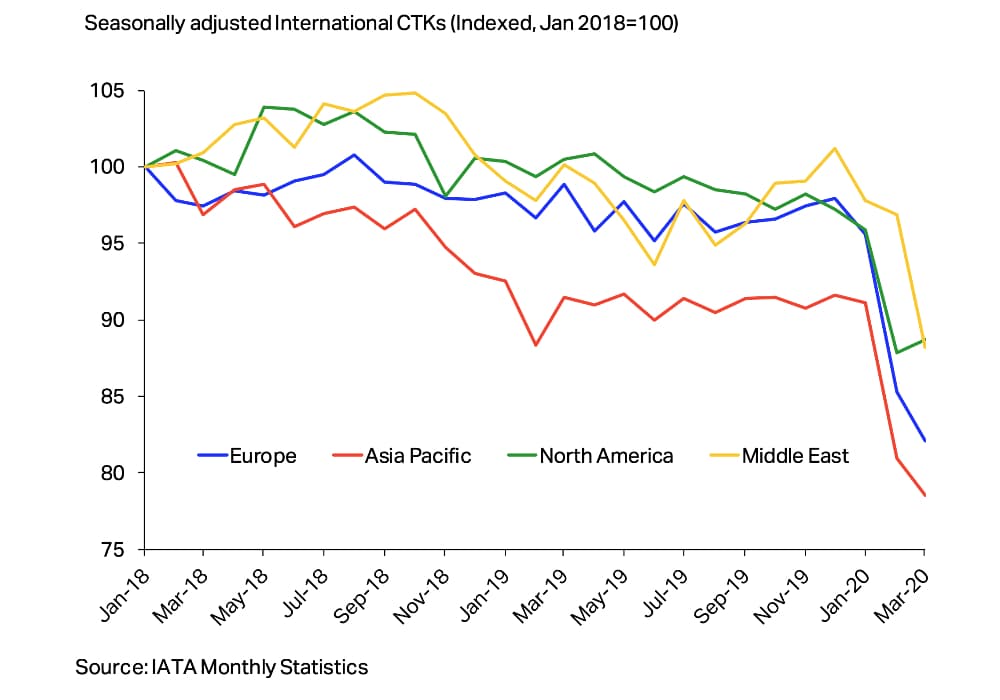
In seasonally adjusted (SA) terms, industry-wide CTKs deteriorated further in March (by 2.8% month-on- month) following the largest monthly decline (9.3%) seen in the history of the series in February (Chart 1).
Chart 1: CTK levels, actual and seasonally adjusted
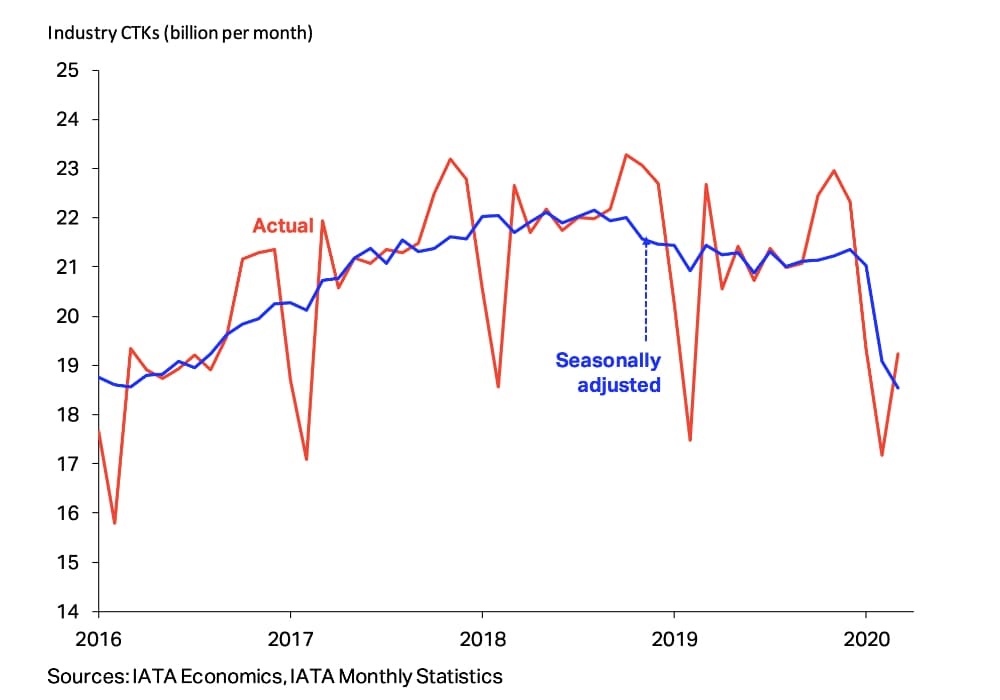
The weakening was widespread across all regions. For the unadjusted CTK data, Asia Pacific, along with both Europe and North America recorded c.18% annual deterioration.
On the other hand, the drop in Africa (-2.1%) was relatively muted as the full lock-down of the aviation market in that region came later in the month of March, compared with elsewhere.
Manufacturing downturn deepened outside of China
Global manufacturing activity continued to contract in March as government-imposed lockdowns caused widespread disruptions.
Following the sharp decline in February – which exceeded that of the global financial crisis – the global manufacturing Purchasing Managers’ Index (PMI) rose slightly in March but remained in contractionary territory.
This improvement was due to the stabilization of the China PMI; excluding the China outcome, the global index fell to its lowest level since May 2009 (Chart 2).
Chart 2: Manufacturing output component of PMI
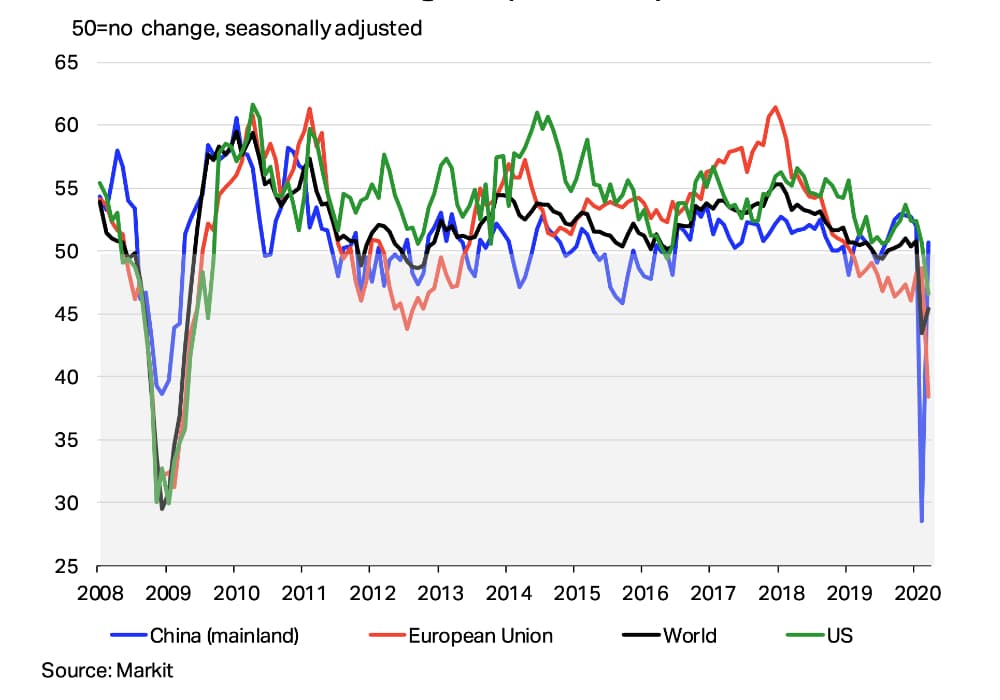
Across the world’s major economies, the manufacturing PMI fell to historically low levels.
The European Union index recorded its largest fall since the beginning of the series, while the US index also declined to an historically low level in April as shutdowns extended to that region in late March/April.
Air cargo market overview – March 2020
Delivery delays peaked as supply chains disrupted
The COVID-19 outbreak continued to put stress on global supply chains as border restrictions, company closures and interruptions in transportation networks caused delays.
In March, supply chain delays lengthened to their highest level since 2004 due to extended factory shutdowns. (Chart 3).
Chart 3: Supplier delivery times (monthly data from manufacturing PMIs)
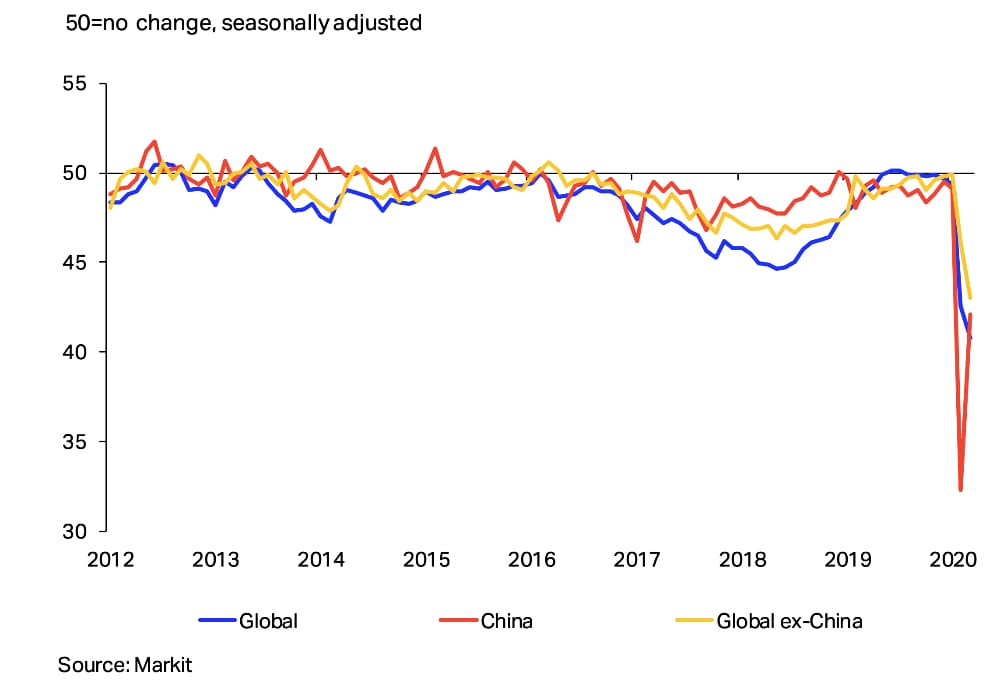
In normal times, a lengthening of supplier delivery times is a sign of robust demand and is typically associated with rising demand for air transport.
However, on this occasion global air cargo capacity is also disrupted with the suspension in passenger flights removing bellyhold capacity from the market and causing a spike in air cargo prices.
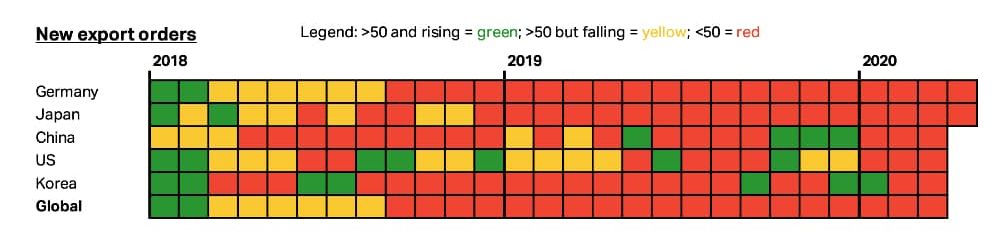
Looking ahead, new export orders for most of the world’s key exporting countries have fallen to levels not seen since the GFC in 2009 (Chart 4).
The sharp slowdown in economic activity and global demand will present ongoing challenges for air cargo over the period ahead.
Chart 4: CTK demand heat-map (monthly data from manufacturing PMIs, selected countries)
Sharp fall in capacity pushed load factors upwards
Industry-wide available cargo tonne kilometres (ACTKs) declined further in March, falling by 22.7% in year-on-year terms. This outcome was widespread across all regions as passenger flights were cancelled around the world.
The cargo capacity of airlines both in Asia Pacific, Europe and Latin America fell by c. 30% annually.
The cargo capacity flown by Middle Eastern carriers declined by around 20% as they acted to adjust their fleet and networks to operate cargo services where borders remained open.
In contrast, the capacity decline in North America and Africa was more limited (both down around 10%). The COVID-19 outbreak affected both regions later in the month of March, which helped to limit the extent of capacity interruption.
As industry-wide air cargo capacity contracted faster than air cargo demand, the industry-wide cargo load factor increased by a sizeable 4.8 ppts in March compared with a year ago.
International cargo volumes fell sharply this month…
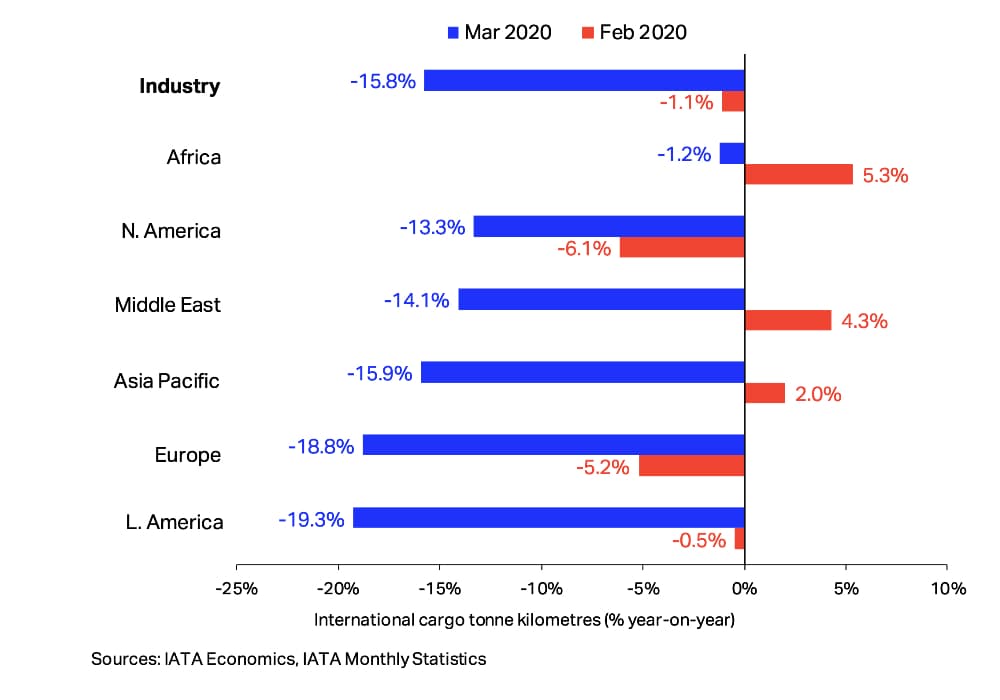
In March, total international CTKs decreased by 15.8% year-on-year, a similar pace to the decline in global volumes (15.2%).
However, this represents a significant weakening compared with the previous two months where the decline in CTKs was primarily limited to the Asia Pacific region.
At the regional level, CTK volumes contracted at double digit levels compared with the prior year period in all regions except for Africa (Chart 5).
Chart 5: International CTK growth
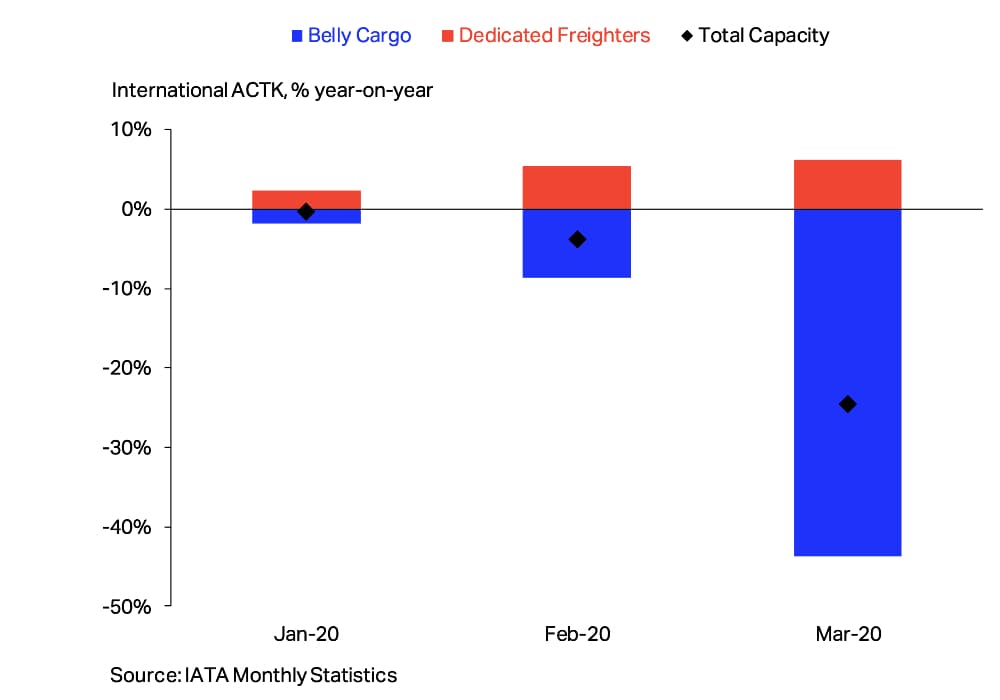
Diverging international capacity growth between freighters and belly cargo carriers.
The cancellation of passenger flights across all regions affected international belly cargo capacity significantly in March.
Although some airlines have converted passenger aircraft to cargo-only flights, international belly cargo capacity declined by 43.7% in year-on-year terms in March.
On the other hand, dedicated freighters continued to increase their capacity in March at a similar pace (6.2% year-on-year) to February.
As a result, the share of belly cargo in total international capacity declined to 46% from 65% in March 2019. Overall, international cargo capacity contracted by 24.6% in year-on-year terms in (Chart 6).
Chart 6: International belly cargo and freighter capacity growth
Downward SA trend accelerated in Middle East
In SA terms, international CTKs declined in all of the largest markets with the exception of North America, which posted a slight recovery (up 1.0%) in March following a sharp decline in the prior month (Chart 7).
For the Asia Pacific airlines, SA CTKs fell further albeit at slower pace compared with February, reaching levels last seen in the third quarter of 2013.
A similar pattern was observed for the European airlines.
The impact of COVID-19 became more pronounced for the Middle Eastern carriers in March as SA international CTKs declined by a sharp 9% compared with February.
Chart 7: SA international CTKs, largest markets
African airlines less affected by disruptions in March
Year-on-year growth in international CTKs of African airlines in March fell by 1.2% following the positive annual outcomes in January and February.
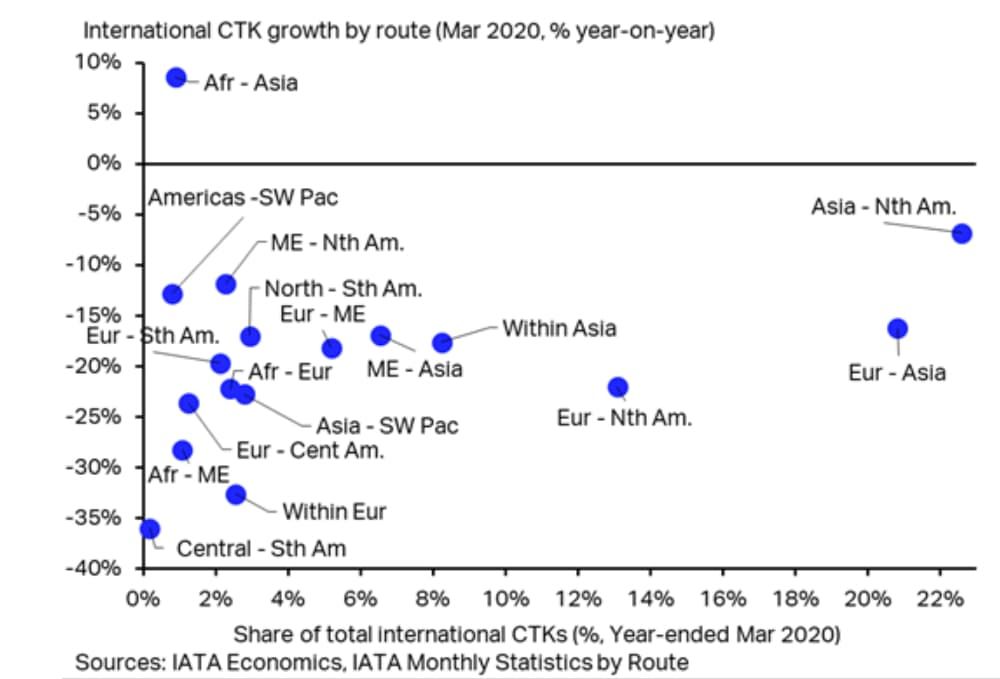
The Africa-Asia market was the only trade lane which continued to post growth in March, with volumes up almost 10% year-on-year (Chart 8).
Chart 8: International CTKs by route (segment-based)
European carriers extended their volume loss
European carriers reported an 18.8% annual drop in international cargo volumes in March, much sharper than the outcome for February (-5.2%).
While Within European CTKs declined significantly (down 32.6% year-on-year) due to widespread shutdowns in the manufacturing sector across the region, the larger Europe-North America and Europe- Asia markets also recorded substantial declines this month.
Growth turned to decline for Middle Eastern carriers
International CTKs reported by carriers in the Middle East declined by 14.1% year-on-year following growth of 4.3% in February.
Among all routes to/from the Middle East, the sizeable Europe and Asia trade lanes recorded falls in the order of 20% in March, while the smaller Africa market saw a decline of around 30%.
Latin American carriers posted the sharpest fall
Carriers based in Latin America posted a 19.3% year- on-year decline in their international CTKs, a sharp deterioration compared with February (-0.5%).
Declines were widespread but most severe for the Central-South America market with volumes down c.35% year-on-year.
CTKs continued to fall in North America
International CTKs of North American carriers declined by 13.3% annually in March, more than double the pace of decline in February (-6.1 %).
Cargo volumes on the Europe-North America trade lane were most affected, falling 22.0% year-on-year.
IATA Economics
28th April 2020
Air cargo market detail – March 2020
P.S. Easy Freight Ltd helps New Zealand importers & exporters to save money on international freight and reduce mistakes by guiding how to comply with Customs and biosecurity rules.
➔Contact us now to learn how we can assist you.